BCD-UI UserInterface is a web based software library for building complex front ends, covering reporting and data entry.
The BCD-UI library is now available as an open source community edition on GitHub.
BCD-UI provides the necessary client and server components for modern browser applications ranging from heavy desktop planning tools to mobile usage
Its pre-built artifacts are combined to produce a user friendly powerful application, supporting your business needs with up-to-date technology.
At its core it consists of components of different abstraction levels, such as application life cycle, widgets and such complex components as scorecards or editable data grids.
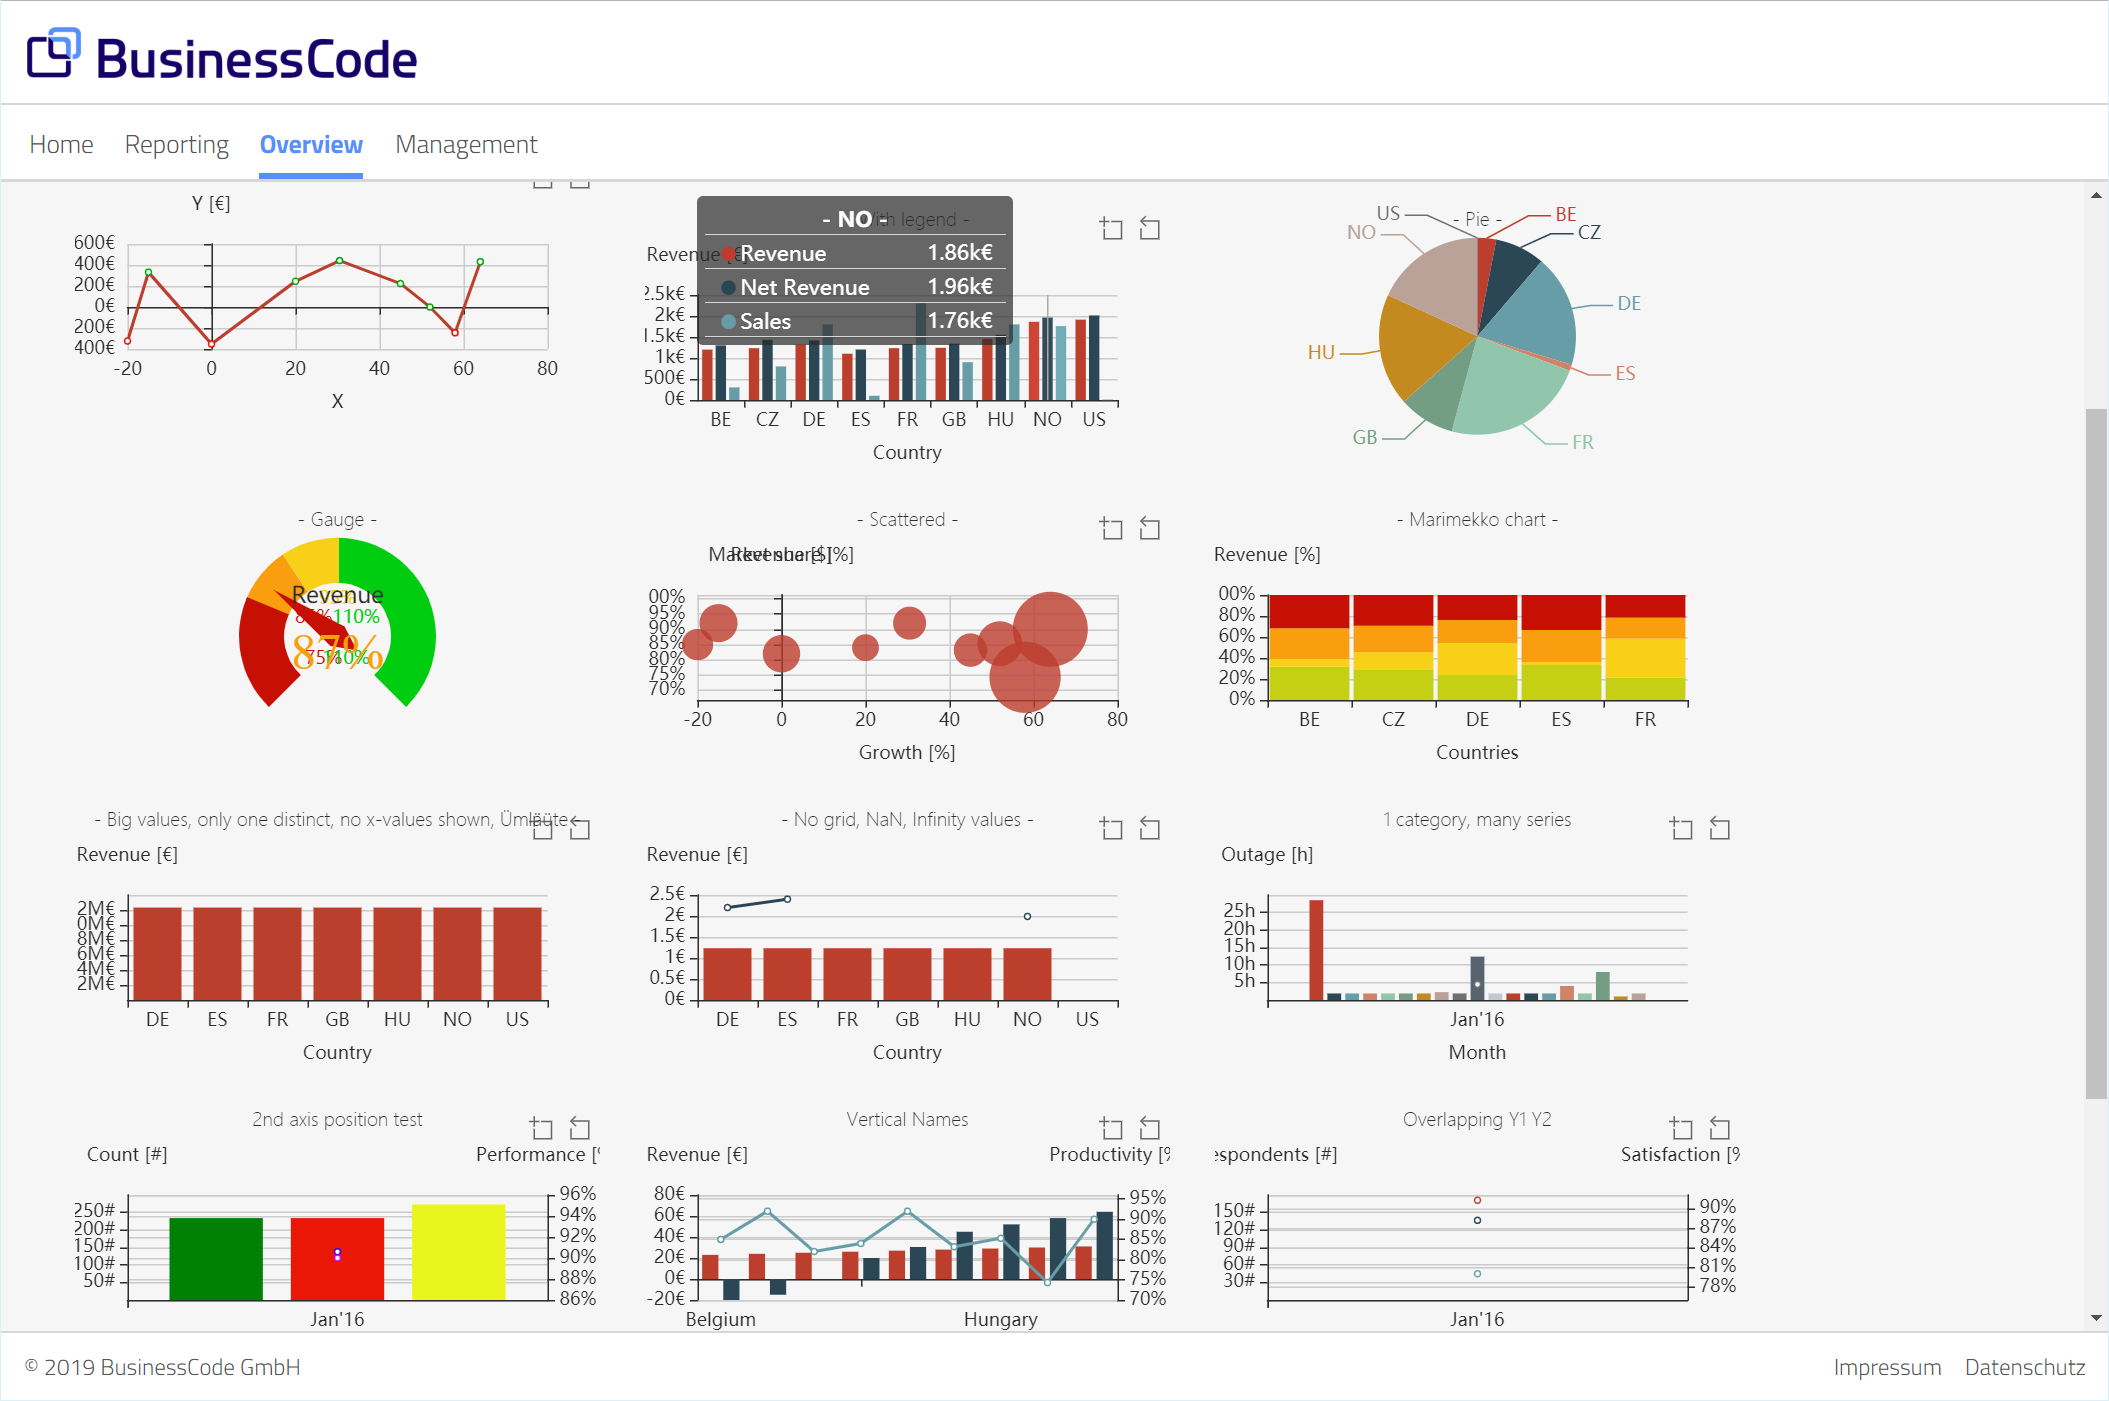
ScoreCard
Your ScoreCards cumulate the information into a set of KPIs. Together with targets, you see at a glance which areas need your attention.
Each participant in reporting sees the KPIs relevant for his or her area and a consistent drill path into lowest detail level is available.
When a KPI is not matching its expectation, i.e. it is below its target, a root cause/break-down for the KPI will provide an actionable view including an impact analysis.
This root cause approach goes way beyond traditional BI, which basically leaves you without a clue about what to do. Instead, the root cause will nail down the actionable reasons behing the issues, enabling a much wider set of people to impact the ScoreCard positively than only analysts.
Reporting
BCD-UI supports specialized reports without limitations for any level of user skill.
When it comes to analysts, you also have the option of creating your report on the fly in a pivot-like manner. But as opposed to what you do with a desktop spreadsheed, you can use virtually unlimitted data for this when using BCD-UI cubes without using proprietory storage.
BCD-UI’s reporting components include plain table views, tree views, drill downs, charts, etc. These views can be deployed as-is or can be specialized for improved user support.
Reference Data Management
Your reference data management on complex data goes beyond simple consistency checks. Using BCD-UI you can cover complex needs for specific entry masks as well as standard structures, supporting the user directly and efficiently
Copy-paste editabled grids allow easy exchange of data with spreadsheets. Custom wizards support complex tasks like setting up base data for logistics networks and labor management. Manual uploading bulk data in csv format allows fast data integration until automized feeds can be deployed.
Maps
Often data can be best visualized on maps. This is not only true when representing KPIs on a higher level to top-management
Your data on local level may need to be shown on maps to be understood. For example delivery times for a logistics provider into a country will have a typical distribution and exception in a pattern. This can be clearly visible on a map and can easily hint you to where there may be errors in the data. As you know, this is almost impossible to detect in a table view, because you lack the geo-component of the data.
BusinesCode has extensive experience in providing specialized, navigatable and even editable maps, embedded in reporting and in reference data management.
Mobile
Web is mobile enabled in todays world. Our components support development for all major mobile platforms in different ways. Keeping the content 1:1 can ease mobile roll-out a lot and can well be used, especially on tablets. For heavy used or complex pages, you can also create a mobile version with its own behaviour.
Our architecture is especially suited for mobile usage as our dynamic front end allows for zero time and zero network-usage switching of views when navigating between pages, that belong together.